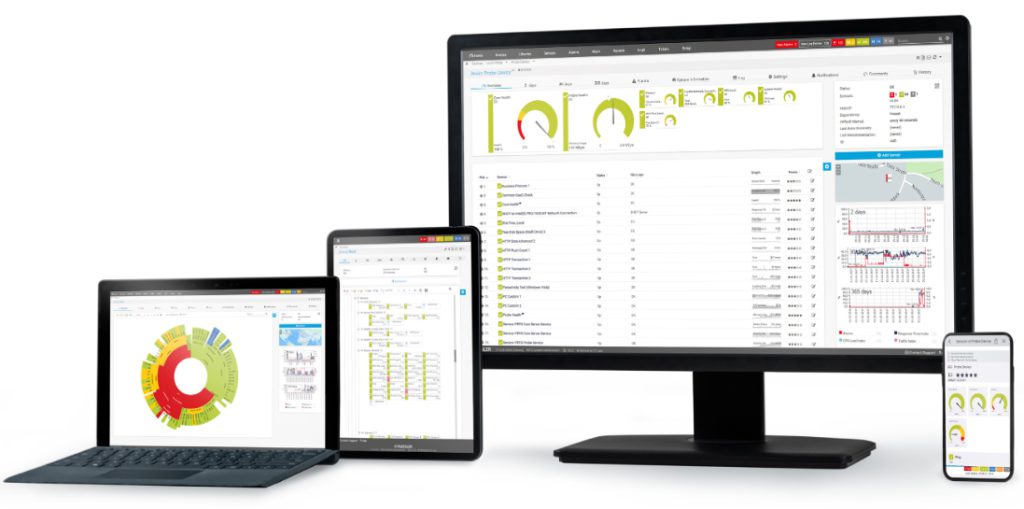
Monitor almost anything and everything, from server rooms to cloud services, and tailor alerts, reports and dashboards to fit your individual business needs.
Paessler PRTG is a powerful network monitoring tool that can be configured to meet your organisation’s individual needs.
With its advanced configuration options, you can customise PRTG to monitor specific devices, hardware, applications, and services, and receive alerts when issues arise.
In this post, we’ll explore some of the advanced configuration options available in PRTG, including the ITOps board, and we’ll give you some examples of how the product’s capabilities can be extended even further!
Advanced PRTG Configuration Options
In addition to the ITOps board, there are several advanced configuration options available in PRTG that can help you get the most out of the tool. Here are a few:
- Custom PRTG Sensors: PRTG comes with a wide range of built-in sensors, but you can also customise PRTG sensors to monitor specific devices or applications. This allows you to monitor virtually anything that has an API or where data can be retrieved using scripts. Krome has had experience deploying several bespoke PowerShell scripts to retrieve data from third-party software and hardware that otherwise could not be monitored. Scripts pull the data, format and pass the results on to the PRTG interface as a sensor where PRTG can assess and notify of status.
- Alerts: PRTG can send alerts via standard methods such as email, SMS, or mobile app push notifications when issues arise however, there is a large number of more advanced notification possibilities as well. Alerting could execute a program, post to a Microsoft Teams channel, call a web page, push to a Syslog server or create an Event log entry. Configuring alerts based on specific thresholds or conditions allows a variety of scenarios to be catered for, including assigning different alert levels to different team members or departments.
- Reports: PRTG can generate reports on network performance, uptime, common errors and alerts and availability. Reports can be on-demand or scheduled to deliver automatically, each one customised to fit your needs. Very useful to keep an eye on historical trends that lead to proactive error and alert prevention.
- Maps: PRTG allows you to create custom maps that display the status of different devices, services or alerts. Maps can be customised with different icons, backgrounds, and colours to make them more visually appealing and easier to read. The inherent web-based live data design lends itself to embedding Maps on Wallboards or intranets or any other web source. If you need to show company excellence on your public website, why not show your infrastructure uptime stats to the world!
- API: PRTG has an API that allows you to automate tasks, integrate with other tools, and customise the behaviour of PRTG. The API pulls raw data from the PRTG back end allowing a great deal of flexibility in how information can be displayed and analysed in other applications using the data from PRTG. If you need to automate tasks such as pausing and unpausing sensors, seeing what devices are currently being monitored or triggering a network scan without using the interface, the API is the place to go.
With real-time data, customised alerts, and powerful reporting capabilities, you can ensure that your network is running smoothly and identify issues before they become major problems.

How can you use PRTG in your environment?
Some interesting examples of how organisations are using PRTG sensors include:
- Monitoring network traffic: By tracking bandwidth usage and identifying bandwidth hogs, you can optimise your network and ensure that things are set up in the most efficient way.
- Monitoring virtual environments: By tracking the performance of virtual machines, hosts, and clusters, you can optimise your environment and ensure that all apps are running smoothly.
- Monitor system uptime: By keeping track of system uptime, it is possible to identify systems which have not been subject to regular updates or security patching either due to failure of a patching schedule or those systems not being correctly enrolled in update platforms.
- Monitor software or firmware version: It is possible to use PRTG as an IT asset management platform, keeping track of the installed versions of software or firmware on devices such as switches and firewalls.
- Monitor SSL Certificate Validity: Monitoring the expiry date of SSL certificates and providing an automated alert, say 60 days before the certificate is due to expire can save websites etc from downtime.
- Monitoring security devices: By monitoring your security devices, including firewalls and intrusion detection systems and by tracking the status and performance of these devices, you can ensure that your network is secure and can quickly identify any potential security breaches.
- Monitoring cloud services: By tracking the performance and usage of cloud resources, inc Amazon Web Services (AWS) and Microsoft Azure, you can optimise your cloud environment and control costs.
- Monitoring UPS systems: By tracking the battery level, load level, and other metrics, you can ensure that your UPS systems are ready to kick in during a power outage and prevent any downtime.
- Monitoring server room temperature: By setting up temperature sensors, you can be alerted when the temperature in the server room rises above a certain threshold, preventing damage.
- Monitoring energy usage: By tracking the energy usage of individual devices and calculating the total energy usage of your data centre, you can identify areas for improvement and reduce costs.
- Monitoring water usage: By tracking the flow rate and temperature of the water, you can optimise your cooling system and reduce water waste.
- Monitoring website performance: By monitoring the uptime, response time, and other metrics, you can identify issues and take corrective action to ensure that your website is always available.
- Monitoring printers: By tracking the ink levels, paper jams, and other metrics, you can ensure that your printers are functioning properly and avoid any downtime due to printer issues.
Customise PRTG Sensors
As a PRTG Enterprise partner, who utilises PRTG internally for our own environment as well as for monitoring our client’s environments, our technical capabilities with PRTG are unparalleled; over the years we have not only heavily customised PRTG, we have also created several new sensors to extend the capabilities of the product even further.
For example, recently we had a requirement to monitor some Veeam backup jobs. Although PRTG does have a Veeam sensor, it has limitations regarding Veeam version and backup types, but with a little lateral thinking and a lot of PRTG experience, we created a new sensor that delivered the desired information:
By leveraging the Veeam API to pull data from the Veeam backend, a PowerShell script gets the job list statistics, such as successes, warnings, and failures, along with failed job names and feeds this into a script sensor in PRTG. PRTG is then set up to trigger alerts to create support tickets automatically if a backup job fails, so they can be diagnosed and resumed. This saves a regular manual check logging into the Veeam console.
Another example where Krome has created a customise PRTG functionality was for a customer with a large PRTG environment, where there were a number of administrators that were able to pause sensors. Unfortunately, people were pausing sensors, but forgetting to resume them again, which was causing the client issues. By running a special PowerShell script that calls the PRTG API, we can look for permanently paused sensors and then resume them, drastically reducing orphaned or forgotten PRTG sensors.
Looking for specific strings in log files and alerting when one occurs is slightly out of the PRTG capabilities list however, a small script triggered by a PRTG sensor can regularly monitor and feedback on historical data. Krome tackled this problem when a customer application needed regular checking via its log files, automation and feeding the data into PRTG gave a record over time of exactly what the developers needed to resolve the troublesome app.
PRTG ITOps Board
ITOps Board is part of Paessler PRTG Enterprise Monitor product. With the ITOps board, you can display real-time data from multiple installations of PRTG, in a customisable dashboard format, providing key stakeholders with a single pane of glass view with the information they need from the wider environment.
- ITOps board helps create a business service-orientated view of your environment rather than a component-orientated view.
- Once set up appropriately for your environment, the clear and focused dashboards communicate a more meaningful view of the health of services.
- Dashboards pull data from multi-server installations of PRTG, whether they be local to your IT environment or even customer platforms where you may have a vested interest.
- ITOps board correlating business services into one location allows a proactive higher-level overview, that using PRTG alone may not allow.
Think of ITOps board as an extension of your PRTG environment, as an alternative to the PRTG maps/dashboards that brings additional functionality, views and SLA monitoring.
By leveraging the wide range of sensors available in PRTG, and using advanced configuration, with real-time data and customised alerts, organisations can ensure that their IT infrastructure is running smoothly and proactively identify and resolve problems before they develop into critical issues.
If you would like to try PRTG, with unlimited sensors, free for 30 days, please click here: 30-day PRTG Network Monitor Trial
If you need any help to customise PRTG or configure it in your environment, or require any help deploying custom PRTG sensors, get in touch with us today on 01932 232345
Want to know more?
Contact us today to explore how our tailored solutions can align with your business priorities.
Join our Krome community


